YOUR PICK
54 /100
Chocolate cereal
A familiar option with particularly high sugar content.
Tell us what matters to you and which ingredients you avoid. Then scan a barcode: IsMyFoodGood explains your score, personal alerts and alternatives that fit your daily life.

A nuanced view of your food, without judgment or oversimplification.
 Product identified
A good source of fiber, with sugar content worth watching.
 Score tailored
The questionnaire builds your food profile. A scan then reveals product information and the criteria behind your result.
Your goals, priorities and the ingredients you want to avoid.
Scan a barcode or search to find a product right away.
An explained score, clear alerts and alternatives to explore.
Keep your scans, shopping lists and habits in one place.
The product page connects its data to your profile. Choose a sample product to explore the score and its detailed explanation.
WHAT ARE WE LOOKING AT?
Every product has more than one side. Nothing here is reduced to simply “good” or “bad.”
What matters most
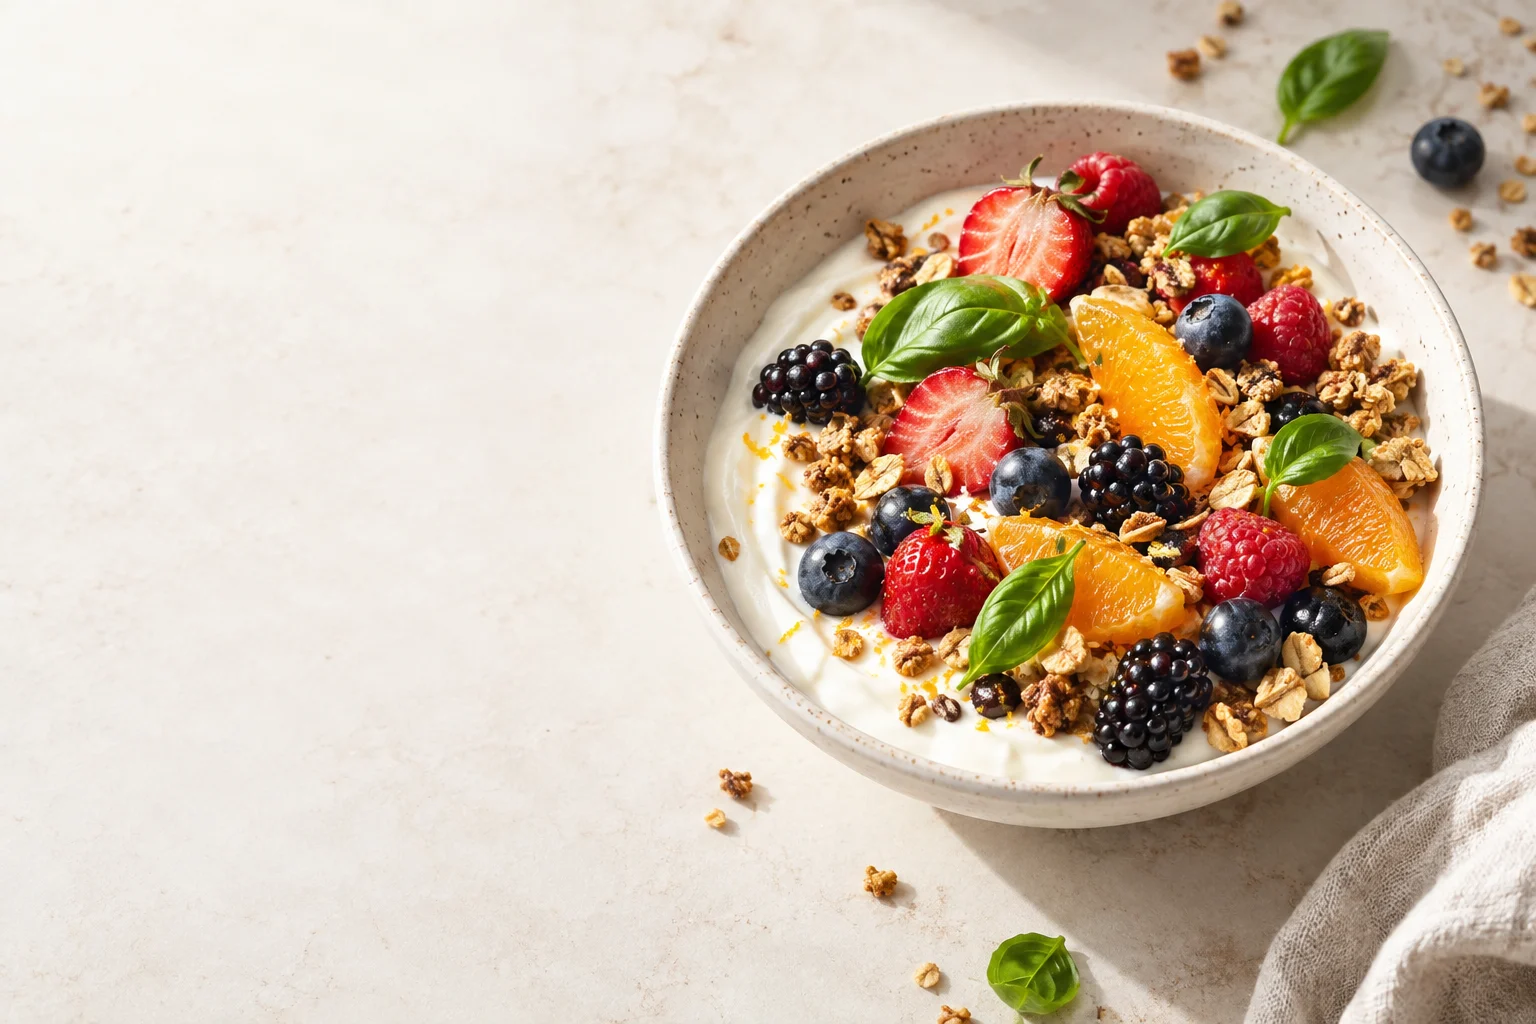
This granola provides fiber and whole grains. Its added sugar is still worth a closer look in light of your habits.
The products, scores and analyses in this demo are fictional. They illustrate the interface, not a real nutritional assessment.
Your answers create a food profile. Each product page explains its score, strengths and alerts. Declared allergens, additives and processing can affect the score according to your preferences.
“The best choice” is not the same for everyone.
An illustration of how to read the score; this calculation does not represent a real product.
The questionnaire gathers your goals, priorities and ingredients you avoid. Product criteria then shape its score and alerts; some goals also guide the assistant's answers.
Depending on the product, additives, processing and declared allergens may change the result.
The assistant can compare products and look for an alternative with a better personal score among available catalog items.
A familiar option with particularly high sugar content.
Worth considering if you want less sugar and more natural fiber.
A fictional illustration of the assistant's comparison. Alternatives depend on the products available in the catalog.
In the mobile app, the assistant knows which product you are viewing. It can explain its score, look up products and suggest alternatives based on available data.
Why is this score lower?
In this example, the granola provides fiber, but added sugar weighs on the result. If sugar is a priority for you, compare the amount per 100 g with the portion you actually eat.
A scan helps you decide in the moment. History, lists and your food journal help you see what matters over time.
Return to a product page without starting over. Each scan joins your personal history.
Create interactive lists and easily find products you want to compare or buy again.
The journal separates products you ate from those you only scanned. Statistics summarize your trends over time.
The screens, product names and values in this section are illustrative. History, lists, the food journal and statistics are part of the project's mobile apps and backend.
Is My Food Good? has been mentioned among apps that help people understand what they buy. See what specialist media have said.
IsMyFoodGood brings together instant barcode scanning, detailed product pages, an explained personal score, an interactive assistant, history, shopping lists and habit tracking.
Your answers create a profile. During product analysis, declared allergens, additives and the level of processing may affect the score according to your saved preferences. Some goals may also guide the assistant's suggestions.
IsMyFoodGood is available on iOS and Android. You can also explore how it works in this page's interactive demo.
No. The products, figures, analyses and screens in the demo are fictional. They show how the app works without assessing a real food product.
No. Scan history and the food journal are separate features. Food statistics use the products recorded in the journal.
Get IsMyFoodGood and discover a new way to make more informed food choices every day.
For iOS
For Android